The Modern Product Analytics Platform: Unifying Insight and Action in 2026

on this page ▾
Your product analytics platform is likely a graveyard for data you'll never use. You spend weeks configuring event tracking only to realize the insights are trapped in a silo, miles away from the tools you use to actually talk to your customers. It's a fragmented mess. You're paying a per-seat tax for every new hire just to look at static dashboards that don't drive growth. It's inefficient, expensive, and frankly, it's exhausting.
We agree that the era of look-but-don't-touch data is over. In 2026, a high-performing product team needs a unified system that tracks, analyzes, and influences user behavior in real-time. This article explains how to move beyond bloated, multi-tool ecosystems toward a single source of truth for user identity. You'll learn how to collapse your tech stack, eliminate engineering bottlenecks, and lower operational costs without losing the depth your data demands. It's time to stop just watching your users and start guiding them.
Key Takeaways
- Static dashboards are obsolete. Learn why a modern product analytics platform must link behavioral data directly to real-time user engagement to be effective.
- Stop guessing why users drop off. Combine quantitative funnel analysis with qualitative session replays to see the exact moment of friction.
- Close the "insight-to-action gap" instantly. Trigger automated product tours and in-app messages based on live user events to drive immediate retention.
- Stop paying the "per-seat tax." Evaluate the operational efficiency of unified systems compared to the hidden engineering costs of maintaining fragmented tool stacks.
Table of Contents
- What is a Product Analytics Platform in 2026?
- The Technical Pillars of Modern Behavioral Insight
- The Death of the Data Silo: Why Analytics Needs Engagement
- Evaluation Framework: Choosing a Platform Without the Per-Seat Tax
- Implementing Kilden: Building Your Growth Engine
What is a Product Analytics Platform in 2026?
A product analytics platform isn't just a digital ledger for events. In 2026, it's a unified engine that tracks, organizes, and interprets every human interaction within your software. Traditional web analytics tell you someone arrived. Product analytics tell you why they stayed, where they struggled, and what made them upgrade. It's the difference between seeing a footprint and understanding the person walking. You need to know the intent, not just the traffic.
The industry has moved beyond simple reporting. We've entered the era of predictive growth modeling. Legacy tools focused on the past. Modern systems focus on the future. They identify patterns in real-time, allowing you to influence behavior while the user is still in the session. You aren't just looking at a dashboard; you're operating a growth suite that combines observation with immediate execution. It is about wholeness, not fragmentation.
The Evolution from Web Traffic to User Behavior
Google Analytics 4 isn't enough for deep product-led growth strategies. It treats users like anonymous sessions. In a high-velocity environment, you need to track specific feature usage and conversion funnels tied to a single source of truth. Clicks and pageviews are noise. Event-based tracking is the signal. When you measure by user identity instead of session IDs, you see the whole journey. This shift allows you to understand the human behind the data, rather than just a string of cookies.
Why Your Current Stack is Likely Broken
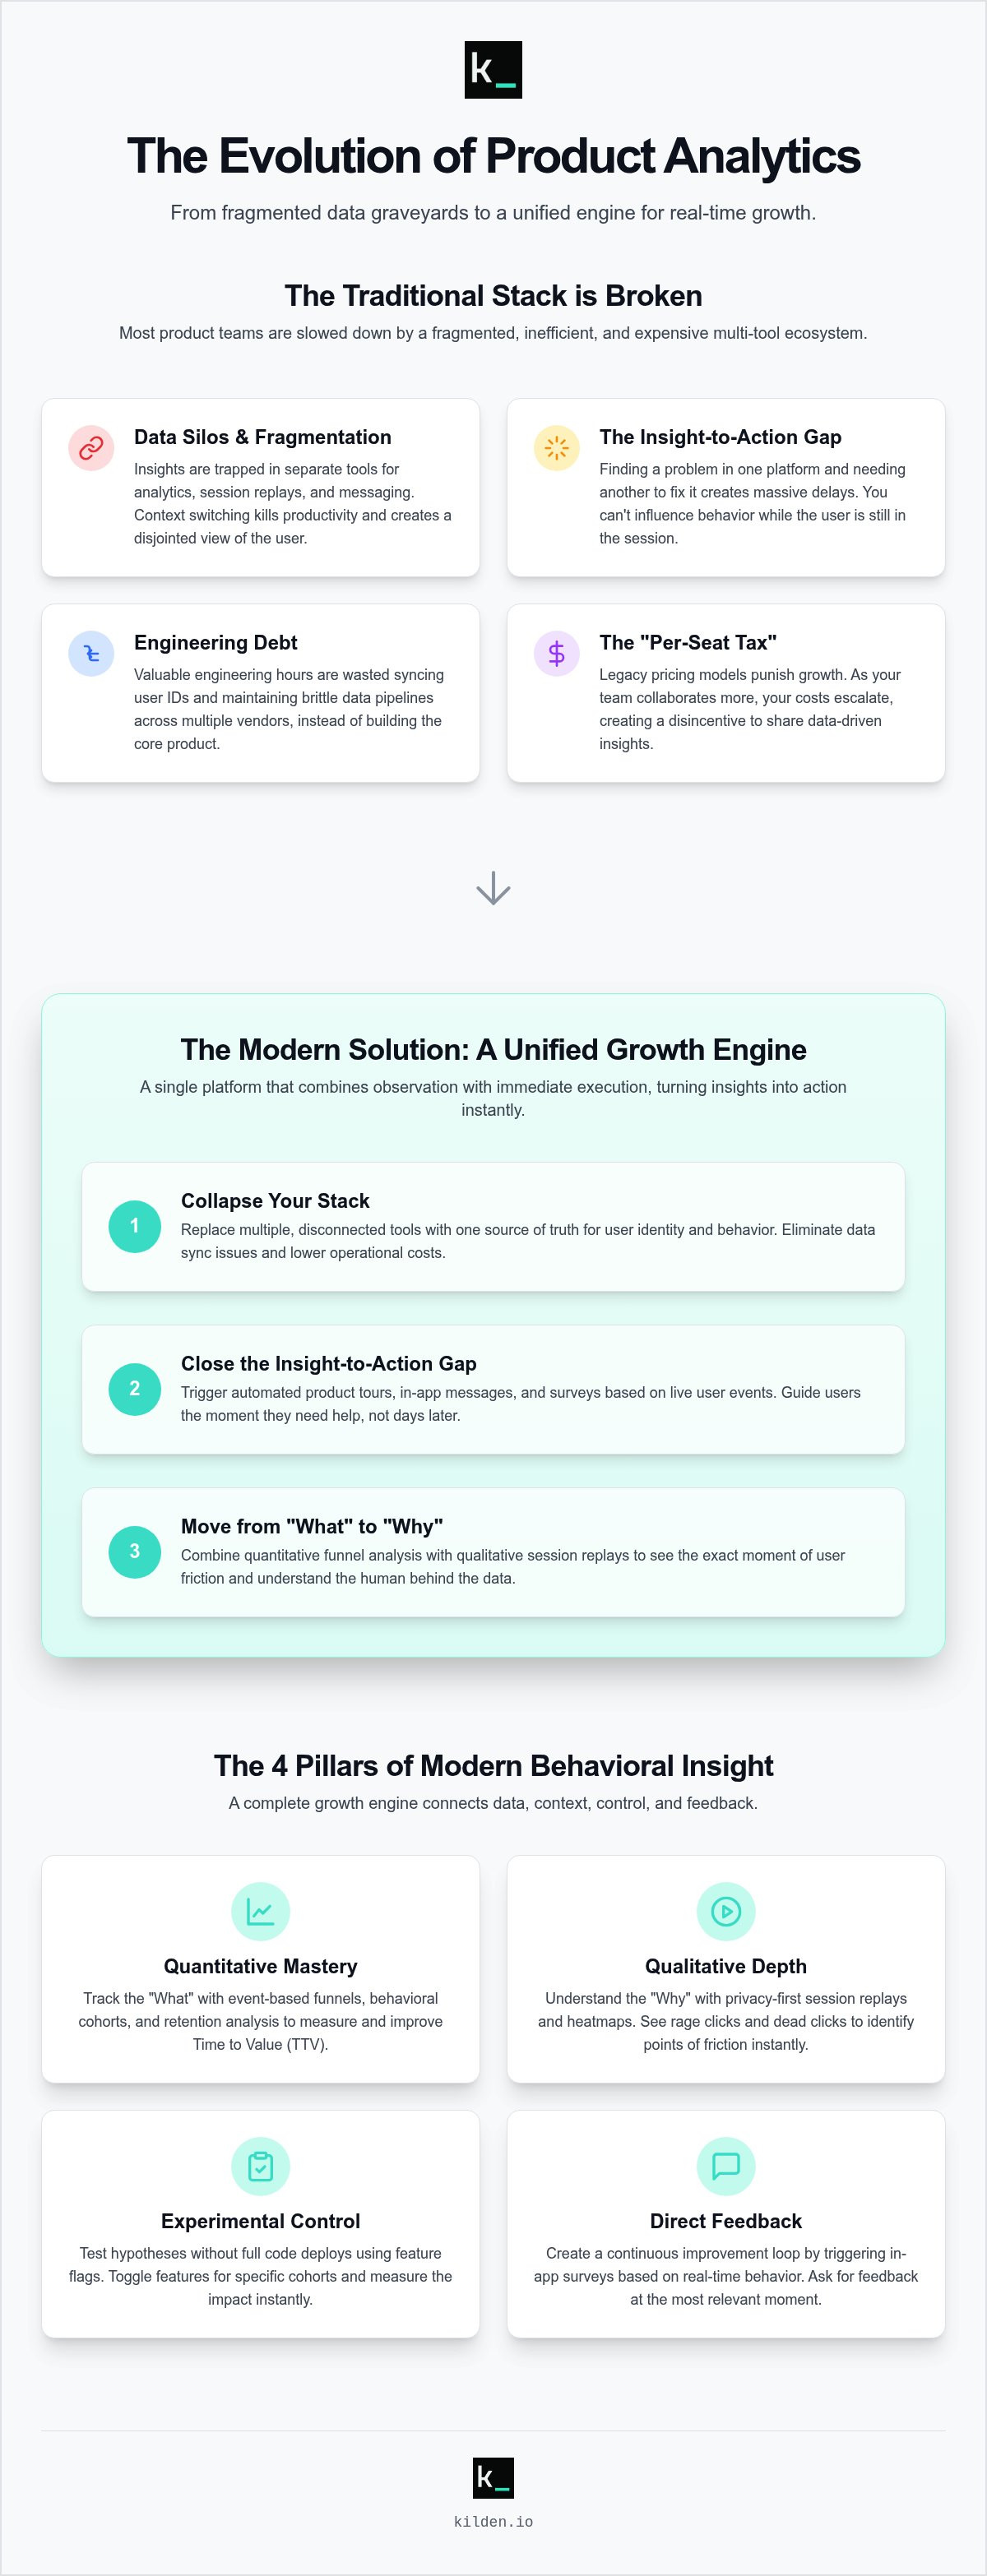
Context switching is a silent killer of productivity. Jumping between different tools for data and messaging creates a massive gap in your workflow. We call this the "Insight-to-Action Gap." You find a problem in one tool but have to build a manual bridge to fix it in another. It's inefficient. It's slow. And it's expensive. This lack of unity stops you from acting when the data is most relevant.
Most teams are drowning in data engineering debt. You're spending valuable engineering hours just to sync user IDs across multiple vendors. Then there's the "per-seat tax." Legacy providers punish your growth by charging more as your team becomes more collaborative. This model is fundamentally broken. A unified product analytics platform eliminates these silos. It gives you depth without the operational overhead. You get clarity without the complexity. It's time to stop paying for friction and start investing in flow.
The Technical Pillars of Modern Behavioral Insight
Data without context is just noise. To build a growth engine, you need a product analytics platform built on four specific pillars: quantitative data, qualitative context, experimental control, and direct feedback. Most teams fail because they treat these as separate silos. They buy one tool for funnels and another for replays. This creates a fragmented view of the user. You don't need more tools. You need a unified system that connects the "What" with the "Why."
Quantitative Mastery: Funnels, Cohorts, and Retention
The linear user journey is a myth. Users jump around. They leave and return. Your funnels must reflect this reality. Quantitative data tracks the "What." It shows you where users drop off. But looking at raw numbers is surface-level. You must group users by behavioral cohorts. Instead of asking who they are, ask what they did. Did they use the core feature three times in the first hour? That is your behavioral cohort. This allows you to calculate Time to Value (TTV). If your TTV is increasing, your product is becoming harder to use. Fix it or lose the user.
Qualitative Depth: Session Replay and Heatmaps
Heatmaps are often misleading. They show you where people click, but they don't show the frustration behind the click. A session replay is different. It provides the "Why." Watching a single session replay is often more valuable than 100 customer interviews. You see the "Rage Clicks" on a button that doesn't work. You see the "Dead Clicks" on an image they thought was a link. This is immediate, actionable friction. In 2026, this must be privacy-first. Mask sensitive data automatically. Don't record what you don't need. Just focus on the movement. If you're tired of managing complex data pipelines just to see these insights, switching to a unified suite simplifies the entire process.
The final pillars are experimental control and direct feedback. Feature flags allow you to test hypotheses without a full code deploy. You toggle a feature for a specific cohort and measure the impact instantly. If it works, keep it. If it doesn't, kill it. Combine this with in-app surveys triggered by real-time behavior. Don't ask for feedback a week later. Ask them the moment they finish a task. This creates a loop of continuous improvement that traditional, fragmented stacks simply cannot match. You don't need a managed data engineering team to sync these insights. You just need a system that was built to work together from day one.
The Death of the Data Silo: Why Analytics Needs Engagement
Silos kill growth. You see a user drop off in your analytics, but your messaging tool doesn't know about it for another 24 hours. That's the "Insight-to-Action Gap." By the time you send that re-engagement email, the user has already moved on. In 2026, a product analytics platform that doesn't talk to your engagement tools is just a rearview mirror. You need a steering wheel. You need to influence behavior while it is happening, not days after the fact.
The power of a unified system is the ability to trigger a Product Tour or an In-App Message based on real-time behavior. Imagine a user struggling with a complex configuration. Your session replay shows them circling the same menu three times. In a fragmented stack, that data sits idle. In a unified platform like Kilden, that behavior triggers a helpful banner or a Messenger prompt instantly. You fix the friction in seconds. This is why our Messenger shares the exact same data identity as our analytics. There is no syncing. There is only one source of truth.
Closing the Loop with In-App Messaging
Stop guessing who is about to churn. Use your behavioral cohorts to identify "At-Risk" users who haven't completed a core action in the last 48 hours. Automate no-code Campaigns to drive feature adoption the moment they log back in. Personalization in 2026 isn't just about using a first name in an email. It's about showing an in-app banner for the specific feature a user needs to see next based on their event history. It feels like assistance, not an advertisement. When the data and the message live in the same house, the experience is seamless.
Feature Flags: The Bridge Between Dev and Product
Feature Flags turn your product analytics platform into an active control room. They allow for safe "Canary Releases" where you roll out a new tool to only 5% of your user base. If the data shows a spike in friction or a drop in retention for that cohort, you kill the feature immediately. You don't wait for a dev sprint. You don't push a hotfix. You just toggle a switch. This empowers product managers to experiment with confidence. It removes the engineering bottleneck and lets the data dictate the roadmap in real-time. If a feature isn't performing, it shouldn't exist. Now, you have the power to make that call instantly.
Evaluation Framework: Choosing a Platform Without the Per-Seat Tax
Silos are a choice. Most companies choose them by default when they buy a separate tool for every problem. You end up with a stack that looks like a patchwork quilt: one tool for data, another for replays, and a third for messaging. This is the "Point Solution" trap. Each tool requires its own integration. Each has its own data schema. You'll eventually need a managed data engineering team just to keep the lights on. A unified product analytics platform like Kilden removes this overhead. It is built to be one system from the first line of code. It respects your time and your budget.
Scalability is the next hurdle. Many tools look affordable when you have five users. Then you grow to 50. Suddenly, your software bill looks like a mortgage payment. This happens because legacy vendors rely on a per-seat tax. They punish you for being collaborative. In 2026, security and compliance are non-negotiable. GDPR, SOC2, and data residency requirements are more complex than ever. You need a platform that handles the legal heavy lifting without charging you extra for the privilege. Security should be a baseline, not an upsell.
The Problem with Per-Seat Licensing
Seat-based pricing is a tax on curiosity. It discourages data democracy. If you have to think twice about inviting a designer or a customer success lead to view a dashboard because of the cost, your product suffers. The industry is shifting toward volume-based or flat-rate models. These are more equitable. They tie cost to the value you get from the data, not the number of people looking at it. Calculate your Total Cost of Ownership (TCO) over a 24-month period. Include the hidden costs of engineering time spent on third-party integrations. You'll quickly see that fragmented point solutions are the most expensive option on the market.
No-Code vs. High-Code Implementation
Can your product manager launch a product tour or a survey without opening a Jira ticket? This is the "No-Code" test. If every small experiment requires a developer, you won't experiment enough. You'll move too slowly. You also need to evaluate the SDK. A bloated library slows down your application and frustrates your users. You want a lightweight footprint that gets your first dashboard live in under an hour. Speed to insight is the only metric that matters during implementation. If it takes a month to set up, it's already obsolete. Switch to a unified product analytics platform that prioritizes speed and eliminates the per-seat tax.
Implementing Kilden: Building Your Growth Engine
Most implementations fail because they take too long. You lose momentum. You lose interest. Kilden is different. You can set up your product analytics platform in under an hour. It is a straight-talk approach to data. No complex engineering requirements. No weeks of planning. Just a lightweight SDK and a clear focus on your North Star metric. Once your core events are mapped, you move immediately from observation to action. You stop being a spectator and start being an architect of your user's journey.
The real power of a unified system is the ability to deploy a session-triggered Product Tour the moment you spot a bottleneck. You don't need a developer to push a new build. You use the live behavioral data to guide users through friction points. This is how you move from fragmented data silos to a single source of truth. Every click, every session replay, and every message lives in the same environment. It is a wholeness that traditional stacks cannot replicate.
The First 30 Days: A Growth Roadmap
Success requires a methodical approach. We've broken it down into a simple, four-week sprint to get you from zero to optimized.
- Week 1: SDK installation and core event mapping. Identify the three actions that define success for your users.
- Week 2: Funnel analysis. Find your "Aha! Moment." This is the exact point where a user realizes the value of your product.
- Week 3: Launch targeted In-app Surveys. Don't guess why users are dropping off. Ask them while they are still in the application.
- Week 4: Scale your engagement. Use automated In-app Banners and Feature Flags to roll out improvements based on the data you've gathered.
Why Kilden is the Logic-First Choice
We built Kilden for teams who value speed over bureaucracy. You shouldn't be punished for being collaborative. That is why we have no per-seat licensing. You shouldn't need a PhD in data science to understand your users. That is why we require no managed data engineering. It is a unified suite designed to be lean and muscular. It gives you the depth of a complex enterprise tool with the agility of a startup. It is time to stop managing your tools and start managing your growth. Stop paying the per-seat tax and unify your product growth with Kilden.
Own Your Product's Future
Fragmentation is a choice you no longer have to make. You've seen how a unified product analytics platform eliminates the "Insight-to-Action Gap" by merging behavioral data with real-time engagement. Static dashboards are history. The future belongs to teams that can identify friction through session replays and fix it instantly with targeted product tours or messenger prompts. You don't need a bloated budget or a team of data engineers to achieve this. You just need a system that works as a single source of truth.
Stop paying the per-seat tax that punishes your team for being collaborative. Switch to a model that values your growth rather than your headcount. By choosing a unified suite, you reduce tool sprawl and lower operational costs without sacrificing technical depth. It's time to reclaim your roadmap and focus on what actually matters: building a product humans love to use.
Start growing your product with Kilden's unified platform today. There is no better time to simplify your stack and accelerate your results. You have the tools. Now, take the lead.
Frequently Asked Questions
What is the main difference between product analytics and web analytics?
Web analytics focuses on traffic sources and pageviews. Product analytics tracks specific behavioral events and user intent. One tells you how they got there. The other tells you what they did once they arrived. It is the difference between counting heads and understanding actions. You need behavioral data to build a better product.
Why should I avoid per-seat licensing for my analytics platform?
Per-seat licensing is a tax on growth. It discourages your team from sharing data because every new user increases your bill. This leads to information silos. You want a model where everyone can access the truth without a financial penalty. Data democracy is essential for a collaborative product team.
How does session replay help in improving product conversion?
Session replays reveal the why behind the what. While a funnel shows you where users drop off, a replay shows you the exact button they could not find. You see the frustration. You fix the friction. Conversion improves because you solved a human problem rather than just moving a data point.
Can I use feature flags without being a developer?
You don't need to be an engineer to manage feature flags. Once the technical foundation is set, product managers can toggle features on or off through a simple dashboard. This allows for safe testing and instant rollbacks without a single line of new code. It removes the engineering bottleneck from your experiments.
How do in-app surveys differ from traditional email surveys?
Context is the main difference. In-app surveys reach users while they are actively using your product. Email surveys arrive hours or days later. The response rates for in-app prompts are significantly higher because they don't interrupt the user's workflow or rely on distant memory. You get the truth in real-time.
What are the benefits of a unified platform over multiple point solutions?
Speed is the ultimate benefit. A unified product analytics platform removes the need to sync data across fragmented tools. You save on engineering hours and eliminate the cost of multiple subscriptions. Most importantly, you act on insights instantly because the data and the engagement tools share a single source of truth.
How long does it typically take to implement a product analytics platform?
Implementation should take less than sixty minutes. If a tool requires weeks of managed data engineering, it is too complex for a high-velocity team. A lightweight product analytics platform allows you to map your core events and see your first dashboard on day one. Speed to insight is the only metric that matters during setup.
Is it possible to track user behavior without compromising privacy?
Privacy and tracking can coexist. Modern tools mask sensitive information automatically before it ever hits the server. You see the behavioral patterns without accessing private personal details. This ensures you remain compliant with global regulations like GDPR while still gaining the insights you need to grow your business.