7 Best Analytics Tools for Product Managers in 2026: Stop Tracking, Start Acting


on this page ▾
Your dashboard is a graveyard of missed opportunities. You track every click, yet you're still guessing why users quit. Most teams are stuck in a cycle of data for data's sake. They see the drop-off but can't stop it. They're held back by silos between their data and their messaging tools. Worse, they're paying a per-seat tax that makes collaboration expensive. It's time to stop tracking and start acting. Finding the right analytics tool for product managers in 2026 isn't just about charts. It's about closing the gap between insight and engagement.
You know the frustration of seeing a bug in a session replay but having no way to message the affected user instantly. We agree that tools should empower you, not tax your growth. This article reveals the top platforms that unify user behavior with real-time action. You'll discover how to trigger in-app messages based on live data and find pricing models that scale with your success. We're comparing seven industry leaders that replace fragmented subscriptions with a single, human-centric source of truth.
Key Takeaways
- Stop collecting data you never use. Learn how to bridge the gap between tracking user behavior and taking immediate action through in-app engagement.
- Evaluate the best analytics tool for product managers in 2026, comparing industry giants like Amplitude and Mixpanel against unified platforms.
- Ditch the per-seat tax. Discover why usage-based pricing allows your entire team to access a single source of truth without inflating your budget.
- Consolidate your stack. See how integrating session replays, feature flags, and product tours into one identity eliminates data silos and saves time.
- Master the Insight-to-Action workflow. Move beyond static dashboards to trigger real-time messages and surveys based on live user triggers.
Table of Contents
- The Fragmented Reality of Product Analytics in 2026
- Categorizing the Top Analytics Tools for Product Managers
- Direct Comparison: Amplitude vs. Mixpanel vs. PostHog
- Beyond the Dashboard: Evaluating the Insight-to-Action Gap
- Kilden: The Unified Alternative to Fragmented Product Stacks
The Fragmented Reality of Product Analytics in 2026
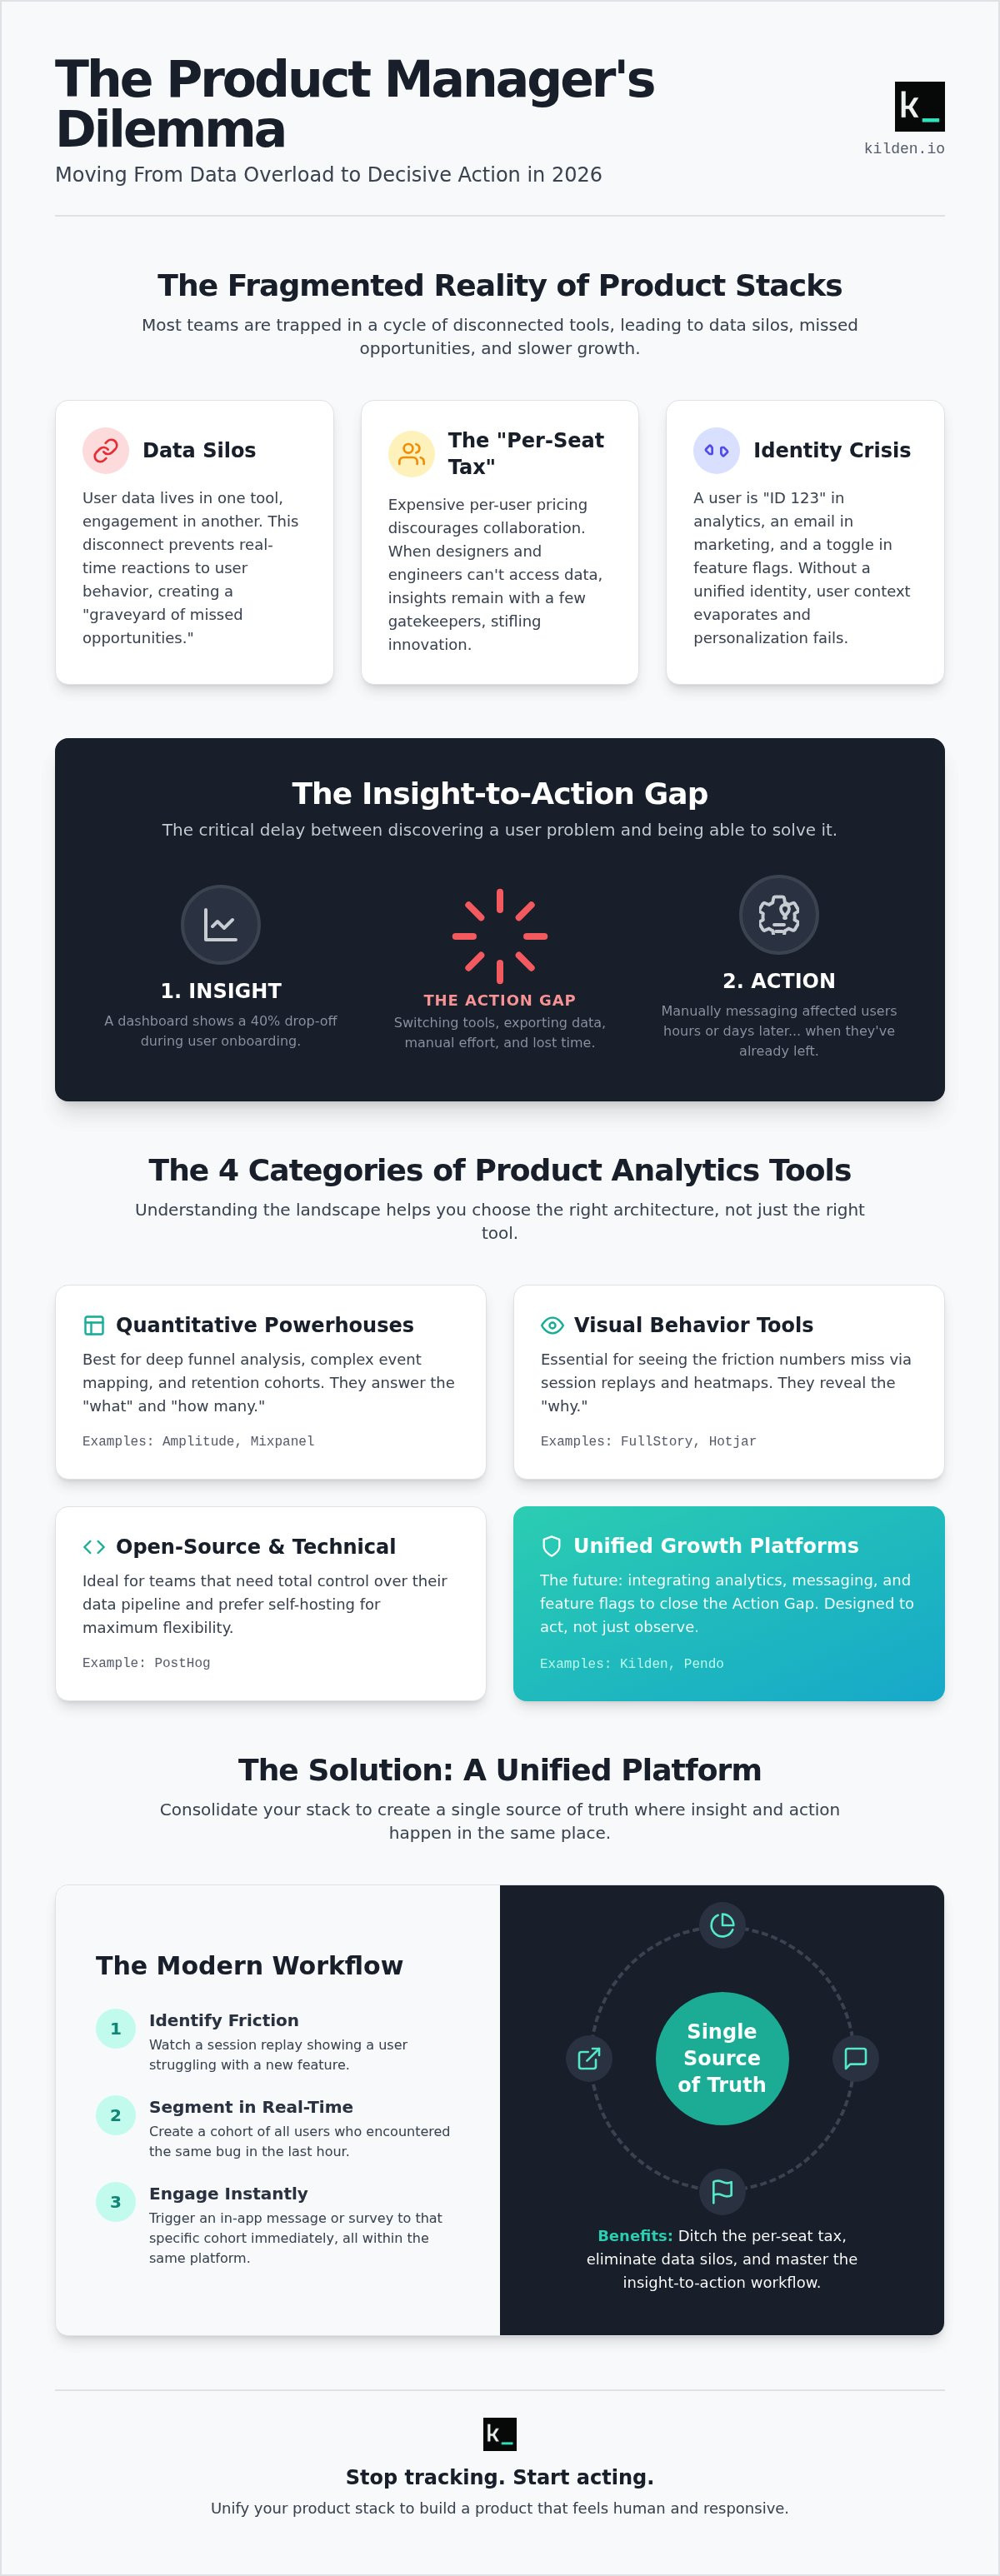
Product managers in 2026 are drowning. You have more data points than ever before, yet you're starving for meaningful action. The industry sold us a "best-of-breed" lie. It told us we needed one tool for funnels, another for session replays, and a third for in-app messaging. This fragmented approach is broken. Managing five different subscriptions doesn't make you more precise; it makes you slower. Data silos have become the primary killer of product-led growth. When your user data lives in one place and your engagement tools live in another, you lose the ability to react in real-time.
Beyond the technical friction, there is a financial drain. The "per-seat tax" in enterprise software actively discourages collaboration. If it costs more to give your designers or engineers access to the data, they won't use it. You end up with a gatekeeper model where only one or two people actually see the truth. This isn't how you build great products. A modern analytics tool for product managers should facilitate transparency, not penalize it.
Why Dashboards Aren’t Enough Anymore
Standard dashboards are post-mortem reports. They show you the "what" after the damage is done. You see a drop in a Key Performance Indicator (KPI), but the dashboard rarely explains the "why." To find that, you have to switch tabs, log into a session replay tool, and hunt for the specific user. By the time you identify the friction, the user is gone.
The friction of switching between platforms to send a simple survey or banner message is unacceptable. We call this the "Action Gap." It's the distance between identifying a user problem and having the technical means to fix it. If your analytics tool for product managers doesn't let you talk to the human behind the data point immediately, it's just a passive record-keeper.
The Identity Crisis in Fragmented Stacks
Fragmented tools create an identity crisis. Your analytics platform sees "User 123" as a set of events. Your messaging tool sees them as an email address. Your feature flag tool sees them as a toggle. When these systems don't share a unified identity, user context evaporates. You can't trigger a specific product tour based on a real-time behavioral trigger because the systems aren't talking.
Maintaining a single source of truth product data is impossible when your stack is a patchwork of APIs. Your analytics and messaging tools must share one identity. Without this wholeness, your data is just noise. You need a system where the observation and the action happen in the same breath. It is the only way to build a product that feels human and responsive.
Categorizing the Top Analytics Tools for Product Managers
The market is a mess of overlapping features. You don't need every tool; you need the right architecture. Most platforms in 2026 fall into four camps. Quantitative powerhouses like Amplitude and Mixpanel remain the gold standard for complex event mapping. Visual behavior tools such as FullStory and Hotjar show you the friction that numbers miss. For technical teams, PostHog offers an open-source approach. Finally, unified growth platforms like Kilden and Pendo represent the shift toward integrated stacks that prioritize action over just observation.
- Quantitative Powerhouses: Best for deep funnel analysis and retention cohorts.
- Visual Behavior Tools: Essential for seeing where users get stuck or confused.
- Open-Source & Technical: Ideal for teams that need total control over their data pipeline.
- Unified Growth Platforms: Designed for PMs who want to trigger messages and flags from their data.
Quantitative vs. Qualitative Tools
Event tracking tells you that users are leaving. It doesn't tell you they're leaving because a button is hidden or a form is broken. This highlights the Importance of Data Analysis in your daily workflow. You need both the "what" and the "why" to make a decision. If you only look at numbers, you're guessing at the solution.
Prioritize behavioral analytics for SaaS when you need to map complex user journeys across multiple sessions. Use session replays to validate your theories. The funnel identifies the wound; the replay shows the knife. Every analytics tool for product managers must now offer a way to see the human behind the data point, or it's already obsolete.
The Rise of the Unified Growth Stack
Modern PMs are tired of duct-taping tools together. Having feature flags and surveys in the same database as your analytics isn't a luxury. It's a requirement for speed. When you identify a churn risk, you shouldn't have to export a CSV to a separate messaging tool to trigger a banner or a product tour. The delay between insight and action is where revenue dies.
Growth platforms solve this by sharing a single identity across all features. However, be wary of the enterprise guard. Most legacy unified tools still charge a per-seat tax that punishes you for being collaborative. This prevents your whole team from seeing the truth. If you want a unified analytics platform without seat limits, look for usage-based models that scale with your data, not your headcount. Choosing an analytics tool for product managers that includes messenger and in-app messaging capabilities ensures your data is actually used to improve the user experience, not just report on its failure.
Direct Comparison: Amplitude vs. Mixpanel vs. PostHog
Choosing an analytics tool for product managers usually feels like a trade-off between power and speed. Amplitude is the heavyweight champion of event mapping. It's built for massive data sets and complex behavioral cohorts. If you have a dedicated data engineering team to manage the taxonomy, it's unbeatable. Mixpanel takes a different approach. It prioritizes the self-serve experience. It's the intuitive choice for PMs who need to build their own reports without waiting for a data analyst to run a SQL query. Both are excellent at showing you what happened, but they often stop at the "why."
PostHog and Kilden represent the move toward unified stacks. PostHog is a developer-first platform. It packs analytics, heatmaps, and feature flags into one ecosystem. However, the technical overhead is significant. You might save on licensing, but you'll spend that money on engineering hours to keep the implementation clean. Kilden offers a streamlined alternative. It provides the same unified power—analytics, session replay, and engagement tools—but focuses on the PM's ability to act instantly. It's built for teams that want to bridge the gap between data and direct user interaction.
Feature Depth vs. Ease of Use
The learning curve varies wildly across these platforms. Amplitude is a cockpit with a thousand buttons. It's powerful, but non-technical PMs often find it intimidating. Mixpanel and Kilden focus on accessibility. You shouldn't need a computer science degree to understand your conversion funnel. The goal is to build a product metrics dashboard that actually triggers action. If your tool requires a data engineer just to track a new button click, it's a bottleneck. Modern tools should allow you to move from a chart to an in-app message in seconds, not days.
Pricing Models: Data Volume vs. Seat Counts
Per-seat licensing is an outdated tax on collaboration. It forces you to choose who gets to see the truth. This creates data gatekeepers and slows down the entire product team. Amplitude and Mixpanel have traditionally leaned on seat-based or MTU-based models that can scale aggressively. PostHog uses usage-based pricing, which is a step forward, but the "PostHog effect" often means you're trading license fees for internal maintenance costs. Kilden operates on a flat-rate approach to team access. We believe everyone on your team should have access to the data. By removing per-seat fees, you encourage data democracy. Your engineers, designers, and marketers can all work from the same source of truth without inflating your monthly bill.
Beyond the Dashboard: Evaluating the Insight-to-Action Gap
Dashboards are post-mortem reports. You see a funnel drop-off and then nothing happens. You wait for a weekly sync. You export a CSV. You upload it to an email tool. By then, the user has already churned. A real analytics tool for product managers must bridge this gap. It shouldn't just show you the problem; it should give you the tools to fix it. Can you message that specific user right now? Can you toggle a feature flag to bypass a broken flow? If the answer is no, you aren't managing a product. You're just watching it fail.
Integrated feature flags are the secret weapon of high-velocity teams. They allow you to run A/B tests based on live behavioral data without a full deployment cycle. Combine this with in-app surveys to validate your assumptions immediately. When you see a high drop-off rate on a new feature, trigger a survey to ask why. This closes the loop. You move from observation to validation in minutes. It's about turning a static data point into a human interaction.
Triggering Engagement from Analytics Data
Automated banners are more than just marketing fluff. They are navigational aids. If a user has visited your settings page three times but hasn't connected an integration, send them a targeted banner. Don't guess which features are working. Use clear frameworks for how to measure feature success to guide your engagement strategy. In-app messengers take this further by providing a direct line for real-time feedback. It turns a cold data point into a productive conversation. This is how you build products that users actually love.
Reducing Time-to-Value with Product Tours
Onboarding is fundamentally an analytics problem. It's the process of moving a user from "curious" to "activated" as fast as possible. Use your data to identify the exact step where users get stuck. Is it the data import? The team invite? Once you know the friction point, deploy a product tour to guide them through. You should be able to do this without a single line of code or a developer release. This agility is what separates growth-focused teams from the rest of the pack. Stop letting your insights rot in a dashboard. Start acting on your user data with Kilden and close the action gap today.
Kilden: The Unified Alternative to Fragmented Product Stacks
Kilden is the response to a decade of bloated, fragmented software. We built the analytics tool for product managers who are tired of duct-taping five different subscriptions just to understand their users. Most teams lose the human element of their data because it's spread across disconnected analytics, session replay, and feature flag tools. Kilden unifies these into a single identity. When you see a user struggle in a session replay, you don't hunt for their ID in another tool. You act. You trigger a messenger conversation or a targeted banner instantly. It's about wholeness, not just data points.
The per-seat tax is the biggest barrier to product-led growth in 2026. It forces you to choose which team members are "worthy" of seeing the truth. We don't do that. Kilden offers zero per-seat licensing. Your engineers, designers, and marketers should all work from the same source of truth. This transparency eliminates the gatekeeper model and lets your whole team move faster. You get a complete engagement suite—messenger, banners, surveys, and product tours—without the technical debt and cost of managed data engineering. Your stack should be an engine for growth, not a source of friction.
One Platform, Zero Silos
Complex integrations like Segment often create more problems than they solve. They add latency, cost, and layers of potential failure. Kilden eliminates the need for middleman data layers by keeping your analytics and engagement tools in one database. This isn't just about efficiency; it's about accuracy. You can deploy targeted campaigns directly from live user data without worrying about sync delays. It's a human-centric approach to growth. You see a behavior, you understand the intent, and you provide the solution. No silos. No lag.
Getting Started with Kilden
Simplifying your stack is the fastest way to increase your speed-to-insight. By replacing three or more fragmented subscriptions, you reduce operational overhead and mental clutter. You stop managing vendors and start managing your product. Kilden is built for teams that value utility over marketing jargon. It's time to stop paying for dashboards that show you problems you can't fix. Experience a unified product stack with Kilden and reclaim your team's agility. This is the analytics tool for product managers who value action over observation.
Closing the Gap Between Data and Action
Product management is changing. You can no longer afford to sit behind a dashboard and wait for a weekly report. The market is shifting toward unified stacks that treat observation and action as a single event. You've seen how legacy platforms create silos and how per-seat taxes hide the truth from your own team. Choosing the right analytics tool for product managers in 2026 means choosing a platform that unifies your identity and your engagement suite.
It is time to stop paying for fragmented data and start investing in user outcomes. Consolidate your tools. Eliminate the seat limits. Bridge the gap between seeing a drop-off and fixing it with a real-time message or product tour. You deserve a system that respects your technical intelligence and your time. Start growing your product with Kilden, no seat limits. Take control of your user experience and turn every data point into a human connection. Success is about what you do with the data, not just how much of it you collect.
Frequently Asked Questions
What is the best analytics tool for product managers in 2026?
The best analytics tool for product managers in 2026 depends on your team's technical maturity and budget. Amplitude remains the leader for complex event mapping, while Mixpanel excels at intuitive reporting. However, if you want to bridge the gap between data and action, Kilden is the superior choice. It unifies analytics with engagement tools like messenger and surveys, ensuring your data leads to immediate user interaction without the friction of fragmented subscriptions.
How do I choose between Amplitude and Mixpanel?
Choose Amplitude if you have a dedicated data engineering team and need to map thousands of complex event properties. It's a technical powerhouse. Choose Mixpanel if you want your non-technical PMs to build their own reports in minutes. Mixpanel prioritizes the self-serve experience. If you're tired of both models and want a unified stack without per-seat taxes, Kilden provides the intuitive middle ground for growth-focused teams.
Why is per-seat licensing bad for product analytics?
Per-seat licensing actively punishes collaboration. When every additional user increases your monthly bill, you naturally limit access to a few gatekeepers. This creates data silos and prevents designers or engineers from seeing the truth. Modern product management requires a shared reality. Usage-based pricing is the only logical model for 2026, as it encourages your entire team to engage with user behavior data without inflating your software overhead.
Can I replace my session replay tool with a product analytics platform?
You can and should replace standalone session replay tools. Fragmented stacks force you to switch tabs and lose user context between platforms. A unified analytics tool for product managers like Kilden integrates session replays directly with event tracking. This allows you to see the exact moment a user gets stuck in a funnel and trigger a fix immediately. Consolidating these features reduces technical debt and ensures your data stays human-centric.
What are the benefits of a unified product growth suite?
A unified suite provides a single identity for every user across analytics, feature flags, and messaging. This eliminates the "Action Gap" where you see a problem but can't fix it. Benefits include faster experimentation cycles, reduced subscription costs, and the ability to trigger in-app banners or product tours based on real-time behavior. It turns your data into an active growth engine rather than a passive record-keeper of past failures.
How do feature flags integrate with product analytics?
Feature flags turn your analytics platform into a laboratory. By integrating flags with behavioral data, you can roll out new features to specific cohorts and measure the impact on success metrics instantly. This allows for safe testing and rapid iteration. You don't have to wait for a full code release to fix a friction point; you simply toggle the flag and observe the change in user behavior in real-time.
Do I need a data engineer to set up Kilden?
No, you don't need a managed data engineering team to set up Kilden. We built it to be a self-serve platform that eliminates the need for complex middleware or third-party data pipelines. PMs can deploy campaigns, surveys, and product tours without writing code. This reduces the time-to-value and ensures that the people closest to the product strategy are the ones controlling the tools. It's about technical agility and efficiency.
Is there a free alternative to enterprise product analytics?
PostHog offers a generous usage-based free tier that's excellent for technical startups. For those who need engagement tools alongside their data, Kilden provides a free tier that includes all features with generous limits. These alternatives are designed to help you scale without the massive yearly commitment required by enterprise versions of legacy tools. You get professional-grade insights and the ability to act on them without the enterprise price tag.