Justify Product Decisions with Data: 2026 Guide


on this page ▾
Your stakeholders don't care about your intuition. In 2026, relying on "gut feeling" is a liability that costs companies up to $15 million annually in operational drag. You've felt the friction. You present a roadmap, only to have it dismantled by an executive who "just has a feeling" about a different feature. It's frustrating. It's a massive waste of engineering time. Knowing how to justify product decisions with data is the only way to stop the interference and reclaim your strategy. You need to move past fragmented metrics and start speaking the language of evidence.
We've reached a breaking point with data silos and the manual time-sink of data engineering. You need a single source of truth that connects the "what" of analytics with the "why" of user behavior. This guide delivers the exact framework for transforming scattered metrics into bulletproof arguments that win stakeholder buy-in every time. We'll show you how to shift from shipping outputs to driving revenue outcomes. You'll learn to use integrated session replays and feature flags to build a repeatable process for roadmap justification. It's time to stop guessing and start proving.
Key Takeaways
- Neutralize "HiPPO" interference by shifting from gut-driven opinions to objective evidence that stakeholders can't ignore.
- Combine hard quantitative metrics with qualitative session replays to build a narrative that explains both the "what" and the "why."
- Implement a repeatable 5-step framework on how to justify product decisions with data to win stakeholder buy-in and increase feature success rates.
- Use lean validation techniques to handle stakeholder objections and provide evidence-based answers in as little as 24 hours.
- Scale your decision-making by removing data silos and per-seat licensing barriers that prevent your team from accessing a single source of truth.
Table of Contents
- The End of Gut-Driven Development: Why Justification Matters
- The 3-Pillar Framework for Data-Driven Justification
- 5 Steps to Justify Your Next Product Feature with Data
- Handling Stakeholder Objections and Winning Buy-In
- Scaling Decision-Making Without the Data Engineering Overhead
The End of Gut-Driven Development: Why Justification Matters
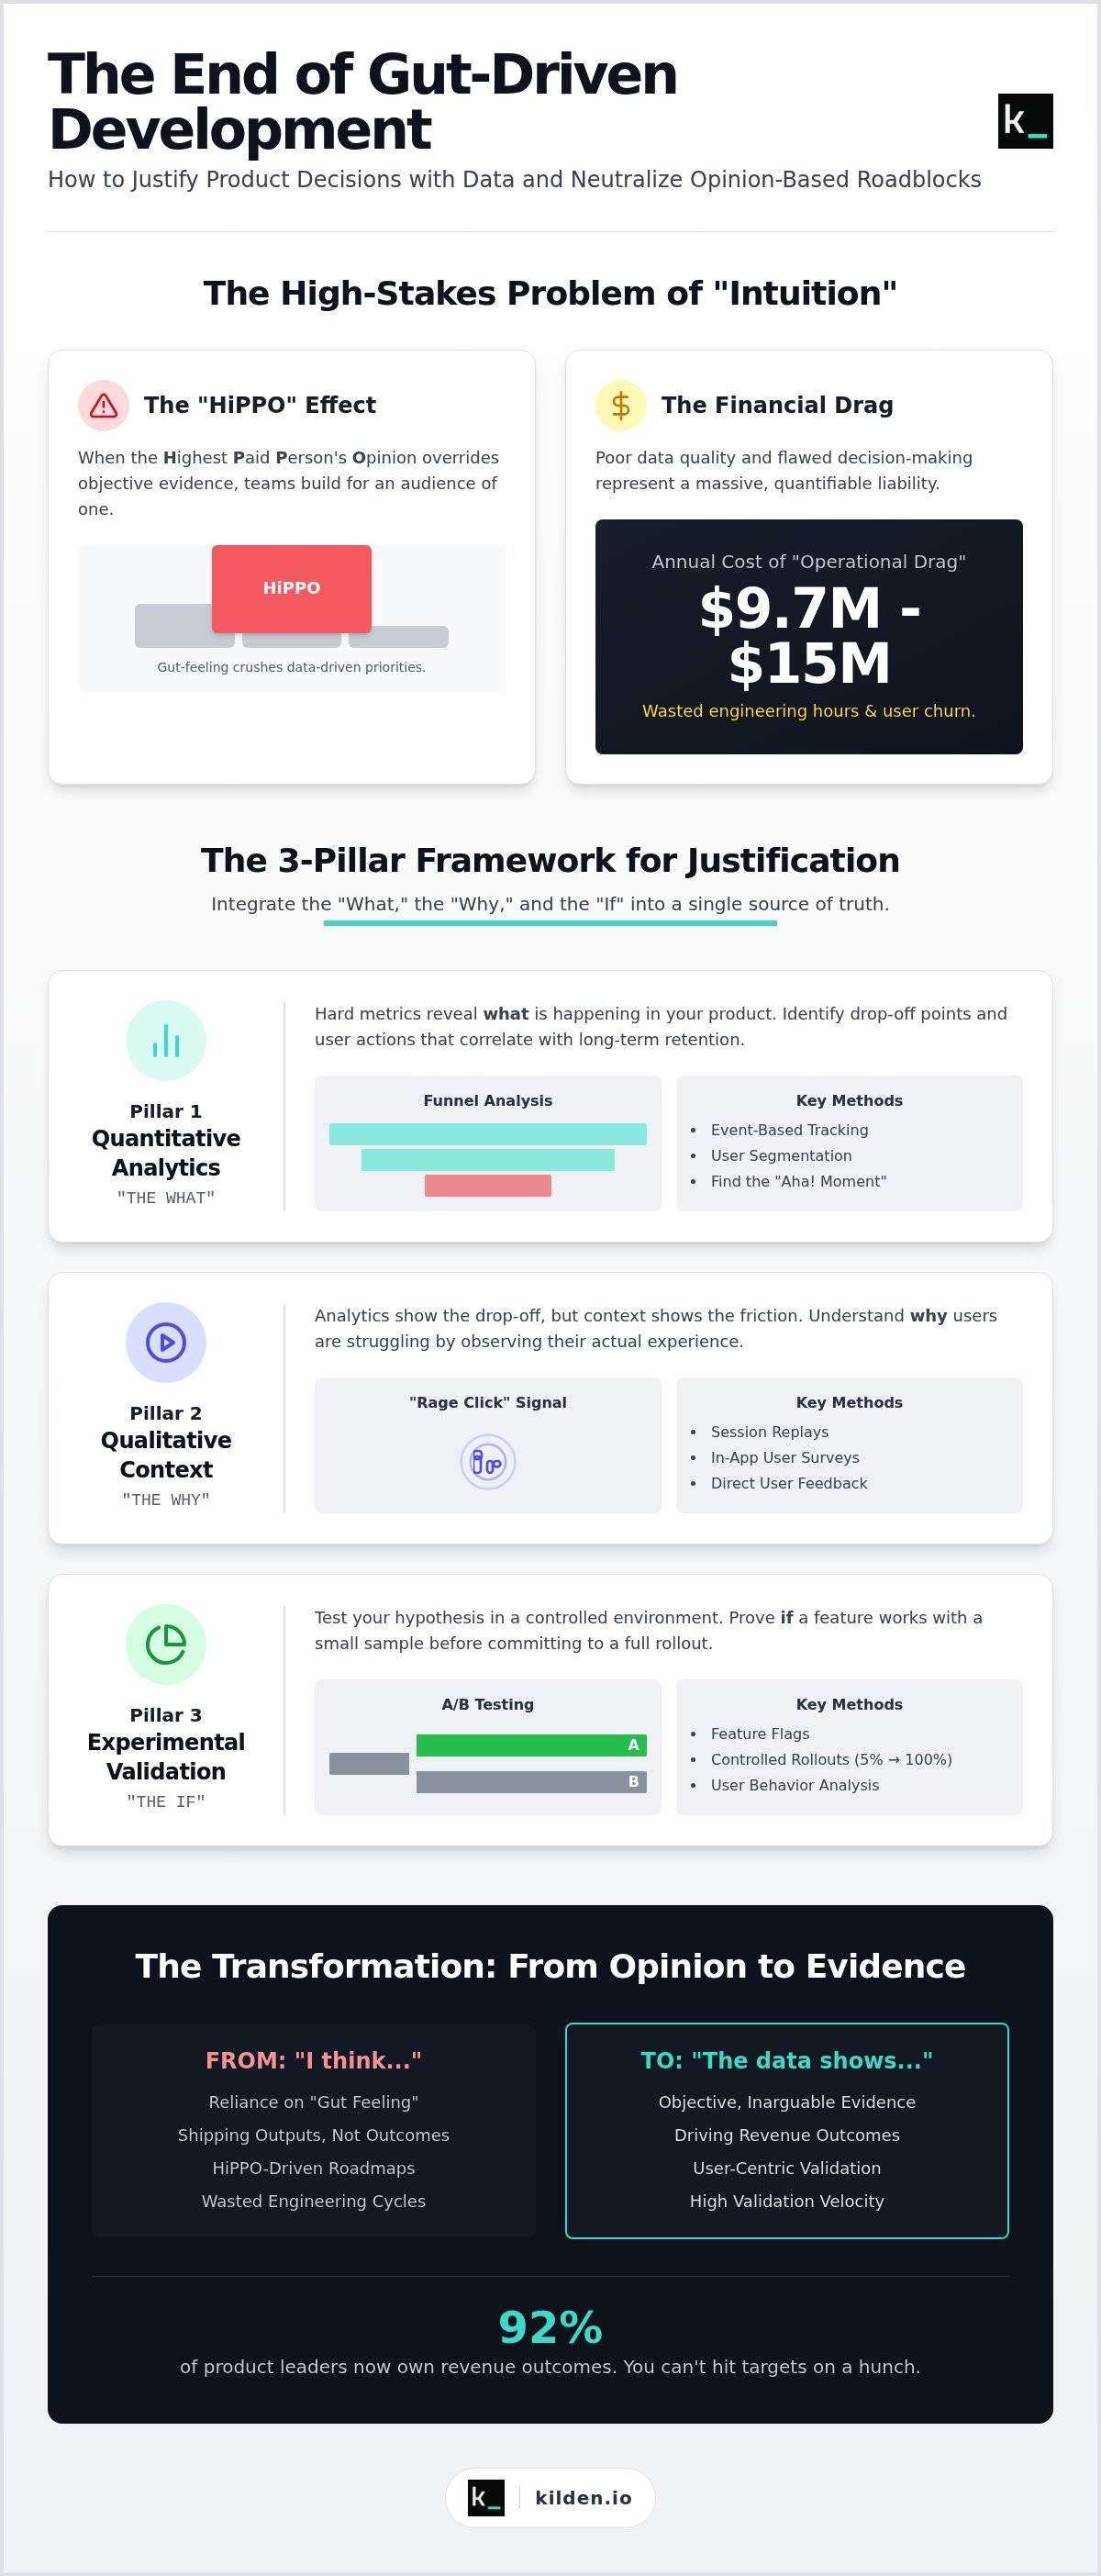
Data justification is more than just looking at a dashboard. It's the systematic use of evidence to validate your roadmap and rank feature priority. Without it, you aren't building a product; you're gambling with company resources. Most teams suffer from the "HiPPO" problem. This happens when the Highest Paid Person’s Opinion overrides technical evidence. It’s the most dangerous metric in your building because it lacks a feedback loop. When a leader's gut feeling dictates the roadmap, the entire team loses the ability to learn from failure. You end up building for an audience of one rather than your actual users.
The cost of being wrong is staggering. Research indicates that poor data quality and flawed decision-making cost companies between $9.7 million and $15 million annually. Every "intuition-based" feature that fails represents hundreds of wasted engineering hours and increased user churn. Transitioning to Data-informed decision-making shifts the burden of proof from your personal reputation to objective reality. Learning how to justify product decisions with data moves the conversation from "I think" to "The data shows." This is critical because 92% of product leaders now own revenue outcomes. You can't hit revenue targets on a hunch.
The Anatomy of a Justified Decision
Major pivots require more than a single metric. Daily Active Users (DAU) might look good while your retention is cratering. A justified decision uses a blend of metrics and confidence scores to quantify impact. Many teams use the RICE framework (Reach, Impact, Confidence, Effort) to strip the emotion out of the room. This rigor kills "feature bloat" before it starts. It keeps your product lean and your users focused on the features that actually drive revenue. You stop building for the loudest voice and start building for the largest impact. Understanding how to justify product decisions with data ensures your roadmap stays focused on what users actually need.
The Relationship Between Velocity and Validation
There is a persistent myth that data slows you down. The opposite is true. Shipping fast is a vanity metric if you are shipping the wrong things. Speed without direction is just noise. Validation Velocity is the speed at which a team confirms a feature’s value. High-velocity teams don't just ship; they validate, iterate, and kill bad ideas before they reach production. By integrating validation into your workflow, you spend less time on manual data engineering and more time on high-impact development. You move from a culture of activity to a culture of results.
The 3-Pillar Framework for Data-Driven Justification
Relying on a single metric is a trap. You need a three-dimensional view of your product to build an unarguable case. This framework integrates the "what," the "why," and the "if" into a single source of truth. It represents the Democratization of Data Science, where evidence is accessible to everyone, not just analysts. Understanding how to justify product decisions with data requires looking at all three pillars simultaneously to eliminate blind spots.
Pillar 1: Quantitative Behavioral Analytics
Hard metrics tell you what is happening. Use product analytics platforms to identify the "Aha! Moment." This is the specific action that correlates with long-term retention. Page views are vanity metrics. They justify nothing. Event-based tracking and funnel analysis prove exactly where users drop off. If 40% of users quit at the credit card screen, you don't need a hunch to justify a checkout redesign. You have the evidence.
Pillar 2: Qualitative Contextual Evidence
Analytics show the drop-off, but they don't show the friction. Use session replay software to see the struggle. A "Rage Click" is a loud signal that a UI element is broken or confusing. Combine this with in-app surveys to collect direct feedback at the exact moment of interaction. This provides the "why" that numbers lack. It is hard for a stakeholder to argue with a video of a user failing to complete a task.
Pillar 3: Experimental Validation
This is where you test the "if." Use feature flags as a safety net for new releases. You can justify a 100% rollout by showing success in a controlled 5% sample. A/B testing lets user behavior settle design disputes. You aren't guessing if a feature works. You are proving it in real-time. This is the final piece of how to justify product decisions with data; showing that your solution actually moved the needle.
These three pillars create a closed loop of evidence. Quantitative data identifies the problem. Qualitative data explains the cause. Experimental data validates the solution. When you use a unified growth suite, these insights share the same identity, eliminating the gaps created by fragmented tools. You stop making guesses and start making moves based on reality.
5 Steps to Justify Your Next Product Feature with Data
Frameworks are theory. Execution is practice. To move from a gut-feeling roadmap to an evidence-based strategy, you need a repeatable workflow. This 5-step process ensures every feature you build has a clear, data-backed reason for existing. It eliminates the ambiguity that allows HiPPOs to hijack your backlog. Here is how to justify product decisions with data through a rigorous, step-by-step approach.
- Step 1: Define the Core Hypothesis. State the problem clearly. Identify exactly who is facing the friction.
- Step 2: Gather Baseline Metrics. Quantify the current state of the world. If you don't know your starting point, you can't measure your progress.
- Step 3: Add Contextual "Why." Use session replays to find the specific friction points. Numbers tell you users are leaving; replays show you they are clicking a non-functional button.
- Step 4: Run a Controlled Experiment. Deploy the solution to a subset of users using feature flags. This limits risk while generating early evidence.
- Step 5: Synthesize into a Justification Memo. Connect your findings to business outcomes. Show how this feature drives revenue or cuts churn.
Formulating a Testable Hypothesis
Stop writing vague feature requests. Every new idea needs a "Justification Requirement" before it hits the backlog. Use the formula: "If we [Action], then [Outcome] will happen, because [Insight]." This structure forces you to ground your intuition in observable reality. It also helps you avoid confirmation bias. Don't just look for data that supports your favorite idea. Actively search for the data that proves you wrong. If the evidence isn't there, kill the feature. It's better to lose an idea than to waste engineering weeks on a failure.
Creating the Justification Memo
Stakeholders won't read a 20-page report. You need a 1-page Justification Memo. Be direct. Start with the "So What?" test. If you can't link a product metric to a revenue or retention goal in the first paragraph, you've already lost. Use clean visualizations. A simple bar chart showing a 15% drop-off in the onboarding funnel is more persuasive than a complex scatter plot. Your goal is clarity, not technical theatre. Present the evidence, state the projected impact, and ask for the buy-in. When the logic is self-evident, the decision becomes a formality. Learning how to justify product decisions with data is ultimately about making the "right" choice the most obvious one in the room.
Handling Stakeholder Objections and Winning Buy-In
Stakeholders often view data as a speed bump. They think it kills momentum. This is a communication problem, not a data problem. You aren't just presenting numbers. You are presenting a resolution to a business risk. Learning how to justify product decisions with data is as much about psychology as it is about analytics. You need to transform data from a gatekeeper into an enabler.
The "Data is too slow" objection is the most common hurdle. Kill this argument with lean validation. Don't wait for a month-long research study. Use in-app surveys or a 24-hour feature flag rollout to get a directional signal. Speed silences critics. When you provide evidence in hours instead of weeks, the objection disappears. You prove that data-driven doesn't mean "slow." It means "correct."
The "We already know the answer" objection requires a different approach. This is where you use counter-intuitive insights. Find a data point that contradicts the company line. Show a session replay of a user struggling with a "favorite" feature. Reality is a powerful equalizer. It forces stakeholders to confront the gap between their assumptions and actual user behavior. It moves the team from a culture of permission to a culture of autonomy.
The Art of the Data-Driven Presentation
Non-technical stakeholders don't care about your methodology. They care about outcomes. Never lead with the "how." Lead with the impact. Show exactly how much revenue is leaking through a broken funnel. Quantify the time lost to support tickets. Use unified product analytics and engagement to show the full lifecycle of a user. When you connect a specific friction point to a business loss, the justification becomes self-evident. You aren't asking for a favor; you're presenting a solution to a quantified problem.
Dealing with Conflicting Data
Analytics might show a conversion spike while session replays show total confusion. Maybe users are "converting" because they can't find the exit or are clicking accidentally. Always trust behavior over stated preference. Users lie in surveys; they don't lie in their clicks. In the hierarchy of evidence, observed behavior is king. Be prepared to admit when the data proves your own initial idea was wrong. Admitting a mistake based on evidence increases your authority. It proves you value truth over ego. This is the core of how to justify product decisions with data effectively. It builds a foundation of trust that makes future buy-in easier to secure.
Stop losing arguments and start winning buy-in with Kilden’s unified analytics suite.
Scaling Decision-Making Without the Data Engineering Overhead
Scaling a data-driven culture usually fails because the tools are too complex. You shouldn't need a dedicated team of engineers just to answer a simple product question. When the barrier to entry for evidence is high, teams revert to gut feelings. It’s faster, but it’s rarely right. Learning how to justify product decisions with data at scale requires a system that prioritizes accessibility over technical theatre. You don't need a more complex stack. You need a more logical one.
Fragmented tools are a tax on your velocity. If your analytics platform doesn't talk to your session replays, you're missing the context required to win arguments. This fragmentation creates data silos that make justification impossible. You end up with multiple versions of the truth. Stakeholders won't trust your roadmap if your data looks like a jigsaw puzzle with missing pieces. Unity is the only path to high-confidence decision-making.
Eliminating the Data Silo Tax
Exporting CSVs is a sign of a broken process. If your team is wasting hours stitching together reports from different tools, you aren't being data-driven. You’re just being busy. High-velocity teams see session replays directly inside their analytics funnels. They don't guess why a user dropped off. They watch it happen. This "Single Identity" approach ensures that every click, survey response, and session recording is linked to a real person. It provides a wholeness that fragmented stacks can't replicate. It turns scattered metrics into a single, unarguable narrative.
Kilden: The Justification Engine
Kilden is built for teams that are tired of the "seat-based" pricing trap. Per-seat licensing kills data-driven cultures. If your stakeholders can’t see the data because of a paywall, they’ll never trust your decisions. We provide a unified suite where analytics, replay, and messaging share the same identity. This allows for immediate qualitative follow-up through in-app surveys or banners. You can validate a hypothesis on day one without waiting for a data engineering sprint.
We eliminate the need for managed data engineering. You get the power of a full data stack without the overhead or the complexity. By automating the justification loop, Kilden simplifies the path from raw insight to decisive action. You can start for free and scale your impact without hitting artificial licensing barriers. This is how to justify product decisions with data in 2026: by making the evidence so clear and accessible that the right decision becomes the only logical choice.
Own Your Roadmap with Evidence
Gut feelings are for gamblers. Product leaders who win buy-in in 2026 use a unified loop of quantitative metrics, qualitative replays, and experimental validation. You've seen the cost of being wrong. You know the frustration of the HiPPO problem. Mastering how to justify product decisions with data isn't just a skill; it's a competitive necessity for hitting revenue targets and reducing churn.
You don't need a bloated data stack or a team of engineers to get there. You need a single source of truth that respects your time and your budget. Kilden offers unified analytics and session replay with a 10-minute setup. We've eliminated per-seat licensing and managed data engineering requirements so your whole team can move faster. It is time to stop arguing and start proving.
Stop guessing and start proving. Explore Kilden’s unified platform.
Your intuition got you here. Let the data take you further.
Frequently Asked Questions
How do you justify a product decision when you have no data?
Start with proxy data or competitor benchmarks to establish a baseline. If those aren't available, launch a smoke test or a low-fidelity prototype to generate immediate evidence. You never truly have no data if you are willing to run a 24-hour experiment. Use in-app surveys to gather qualitative signals from your existing users before committing engineering resources. Action is the best way to generate the evidence you lack.
What are the most important metrics for justifying a new feature?
Focus on metrics that link directly to revenue or retention. Conversion rates within specific funnels and Time to Value are critical signals. Avoid vanity metrics like page views or total sign-ups. Instead, track the Aha! Moment where users realize the product's utility. High-confidence justification requires showing how a feature moves a user from a trial state to a loyal, paying customer. Context is what transforms numbers into arguments.
How do you convince stakeholders to trust the data over their intuition?
Show, don't just tell. Present a session replay of a user struggling with a feature the stakeholder loves. Seeing real-world friction is more persuasive than any spreadsheet. Use a Single Identity approach to prove that the data represents real humans, not just abstract numbers. When you visualize the gap between stakeholder assumptions and user reality, the logic for a data-driven pivot becomes self-evident. Reality is a powerful equalizer in any boardroom.
What is the difference between data-driven and data-informed decision making?
Data-driven teams let the numbers dictate the path without exception. Data-informed teams use metrics as a primary guide but include qualitative context and strategic intuition. Knowing how to justify product decisions with data usually requires a data-informed approach. You use the "what" from analytics and the "why" from session replays to build a narrative that accounts for human behavior and long-term business goals. It is about balance, not blind obedience.
Can qualitative data alone be used to justify a product decision?
Yes, especially for UI fixes or early-stage discovery. A single session replay showing a user failing to find a checkout button is enough to justify an immediate change. However, for major roadmap shifts, you should pair qualitative insights with quantitative volume. Use in-app surveys to see if a frustration seen in one replay is shared by a significant percentage of your total user base. Volume adds weight to the friction you've observed.
How do you handle data that contradicts a popular stakeholder opinion?
Present the contradiction as a risk-mitigation opportunity. Don't frame it as a personal challenge to the stakeholder's authority. Use the lean validation method to run a small-scale experiment that tests the stakeholder's hypothesis against what the data suggests. Letting a 5% user sample decide the outcome via feature flags removes the ego from the room. It shifts the focus from who is right to what actually works for the business.
What tools are best for collecting data to justify product roadmaps?
Unified platforms that integrate analytics, session replay, and feature flags are the most effective. Fragmented tools create silos that lead to conflicting versions of the truth. Use a suite that offers Single Identity tracking so you can follow a user from their first click to their final feedback survey. This provides the wholeness needed to learn how to justify product decisions with data without wasting time on manual data engineering or CSV exports.
How often should you review data to justify ongoing product decisions?
Review core metrics daily and conduct deep-dive justification audits weekly. Product development moves too fast for monthly reports to be useful. In 2026, 92% of product leaders own revenue outcomes; this requires real-time awareness. Use automated dashboards to monitor how new features perform against their initial hypotheses. Continuous review ensures you can kill failing ideas quickly before they drain your engineering budget or increase user churn. Stay agile or stay behind.