How to Measure Feature Adoption: A Diagnostic Framework for 2026

on this page ▾
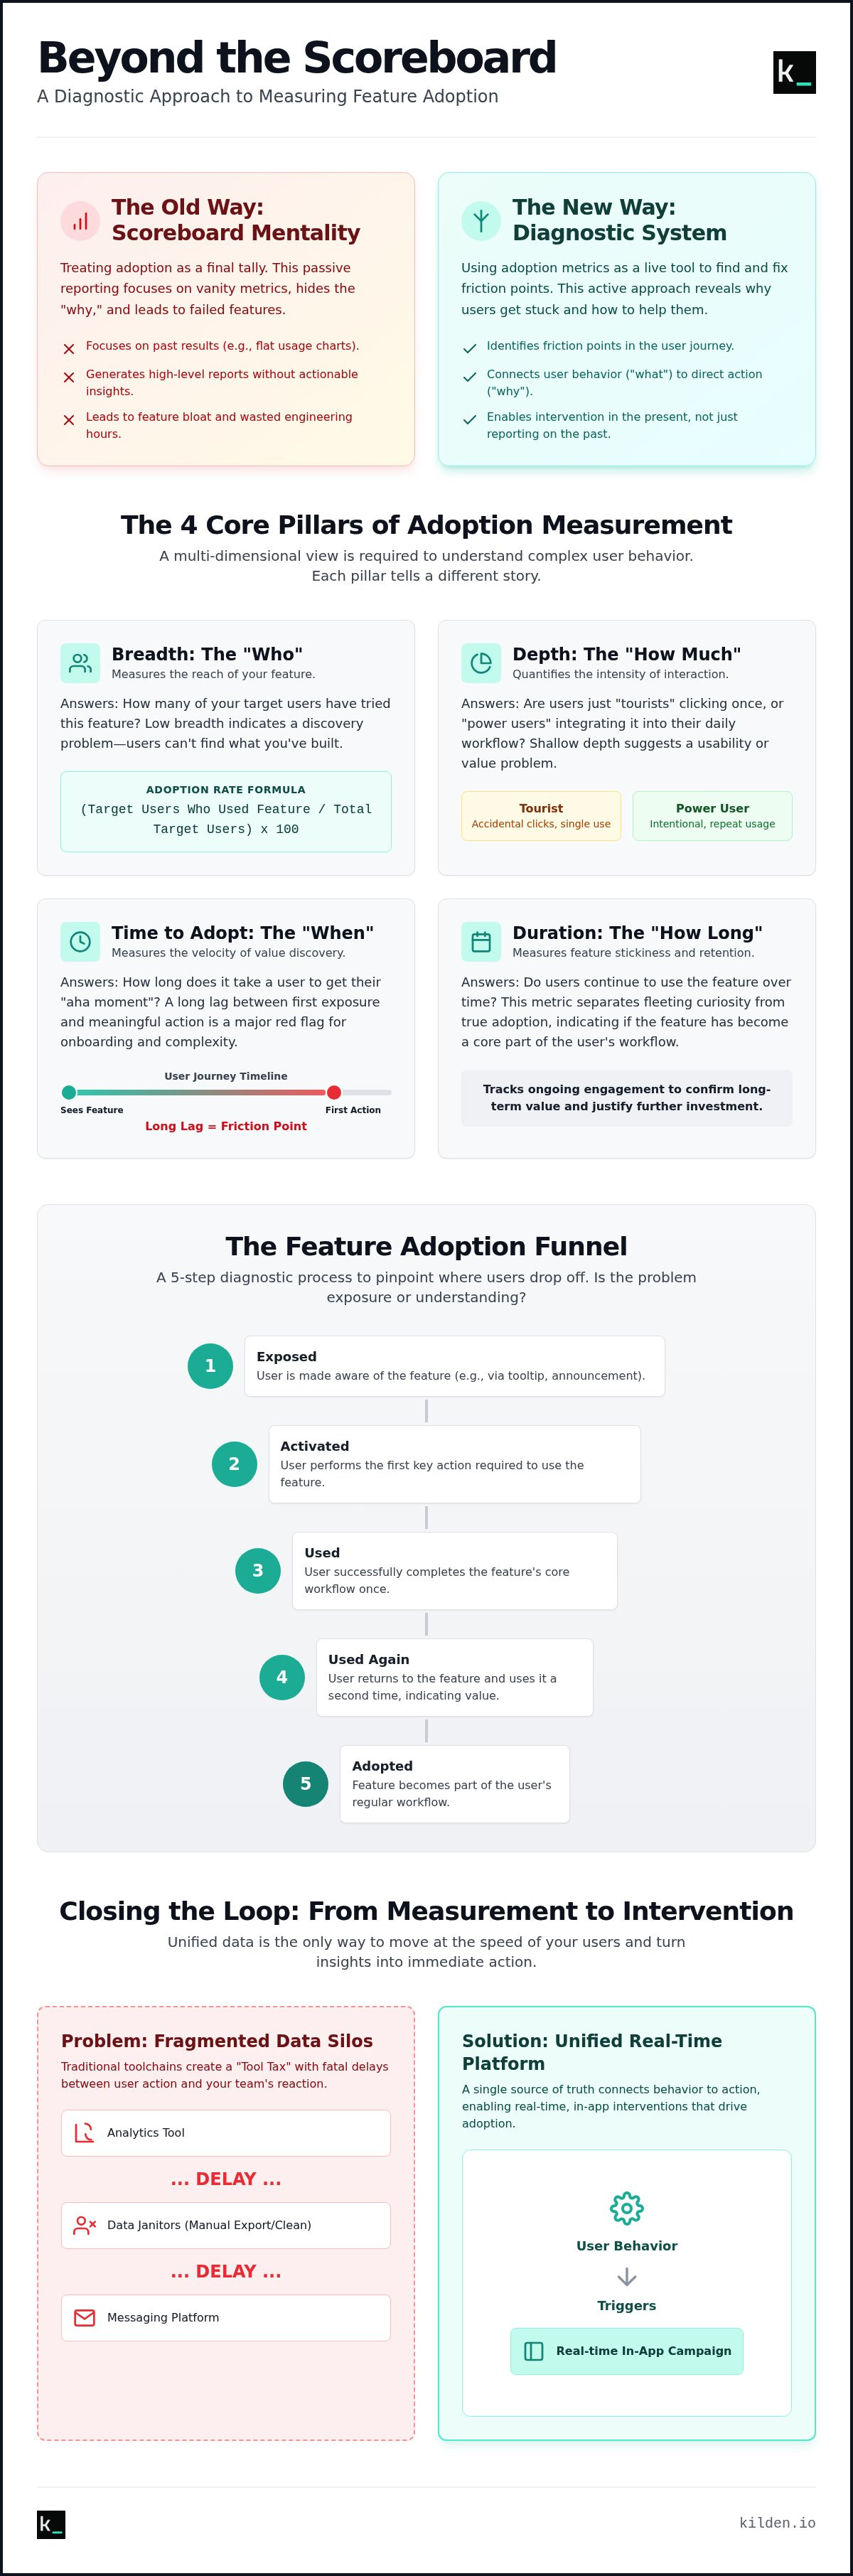
Stop treating your adoption metrics like a scoreboard. Most product teams look at a usage chart, see a flat line, and assume the feature failed. But a scoreboard only tells you the final tally. It doesn't explain why your users are stuck or where they lost interest. Learning how to measure feature adoption is not about generating vanity reports for leadership. It is about building a diagnostic system that reveals the friction points killing your product's momentum.
You already know the frustration of fragmented data. You check one tool for analytics and another for messaging. The numbers don't align. High per-seat licensing fees keep your team in the dark while features die on the vine. You can't see the "why" behind the "what." It is a broken cycle that wastes engineering hours and drains your budget. You need a single source of truth that connects user behavior to direct action.
This guide changes that. We are moving past passive reporting and into active intervention. You will learn a clear framework for feature success that reduces time-to-value and justifies your roadmap with hard evidence. We will show you how to use session replays and unified data to turn struggling features into core drivers of user retention.
Key Takeaways
- Stop treating adoption as a scoreboard. Use it as a diagnostic tool to identify exactly where and why users lose interest.
- Master how to measure feature adoption by balancing the breadth of your reach with the depth of user interaction.
- Audit your feature funnel. Pinpoint whether adoption failures stem from a lack of exposure or a lack of understanding.
- Connect the "what" to the "why." Use session replays to see the human friction that standard analytics charts miss.
- Bridge the gap between measurement and intervention. Use real-time data to trigger in-app campaigns that drive immediate value.
Table of Contents
- Beyond the Scoreboard: Why Most Feature Adoption Tracking Fails
- The 4 Core Pillars of Feature Adoption Measurement
- The Feature Adoption Funnel: A 5-Step Diagnostic Process
- Closing the Loop: From Measurement to Intervention
- Scaling Your Adoption Strategy with Kilden
Beyond the Scoreboard: Why Most Feature Adoption Tracking Fails
Most product managers view adoption as a retrospective. They look at a dashboard once a month. They see a number. They move on. This is measuring adoption in a vacuum. It leads to feature bloat where you ship more code to fix a problem you haven't diagnosed. You don't need more features. You need to understand how to measure feature adoption as a live diagnostic tool. Stop reporting on the past. Start intervening in the present.
High usage doesn't equal success. If 10,000 users click a button once and never return, your adoption isn't high; your curiosity is. Diagnostic metrics tell you where the friction is. They show you the gap between a user seeing a feature and finding value in it. This requires a shift in perspective. You aren't just tracking clicks. You are tracking the human journey through your software. If that journey ends abruptly, the feature has failed, regardless of the total click count.
Understanding the Technology Adoption Life Cycle is critical here. Your early adopters might use a feature because it's new. Your late majority might ignore it because it's buried. If you aren't segmenting your data, you're looking at a blurred average of failure. This blurred data leads to poor roadmap decisions and wasted engineering resources. You end up building for everyone and satisfying no one.
The Trap of Total Usage Numbers
One thousand clicks is a meaningless data point. Without cohort context, you're guessing. Did those clicks come from your power users or from new signups who got lost? You must contrast total usage with target segment usage. If your advanced reporting feature is only used by trial users who then churn, the feature isn't working. It's just a distraction. Relevant Usage is the only metric that justifies R&D spend.
Data Silos: The Silent Killer of Product Growth
Fragmented stacks create a Tool Tax. You export data from your analytics tool. You clean it. You import it into your messaging platform. By the time you send a nudge, the user has already logged off. This lag kills the aha moment. Traditional workflows often require expensive managed data engineering just to keep these systems talking. This friction prevents real-time intervention. It turns your product team into data janitors. You can learn more about Why Data Silos Kill In-App Messaging Engagement in 2026. Unified data is the only way to move at the speed of your users.
The 4 Core Pillars of Feature Adoption Measurement
Measuring adoption isn't about finding a single "magic" number. It requires a multidimensional view. If you only track one metric, you're looking at a flat image of a complex human behavior. To truly master how to measure feature adoption, you must break it down into four core pillars: Breadth, Depth, Time to Adopt, and Duration. Each one tells a different story about why your users stay or leave.
Breadth and Depth: The "Who" and "How Much"
Breadth measures your reach. It's a simple calculation: (Target Users who used feature / Total Target Users) x 100. If your breadth is low, your discovery layer is broken. Users can't find what you've built. But breadth alone is a vanity metric. You need Depth to see if that usage actually matters. Depth quantifies how thoroughly users interact with the feature. Are they "power users" who integrate it into their daily workflow, or "tourists" who click it once and never return?
You must distinguish between accidental clicks and intentional usage. A user who clicks a button because it's placed poorly isn't an adopter. They're a victim of bad UI. This concept is backed by the Technology Acceptance Model (TAM). The model proves that perceived ease of use is a primary driver of actual usage. If your "Depth" is shallow, it's often because the feature feels like a chore rather than a solution. Don't reward yourself for high breadth if your depth is non-existent.
Time and Duration: The Velocity of Value
Time to Adopt tracks the duration between a user first seeing a feature and taking their first meaningful action. A long lag here is a red flag. It signals that your "aha moment" is buried under too much complexity. If it takes three days to find a core tool, your onboarding has failed. You can use integrated feature flags to run phased rollouts and measure this velocity in real-time. By testing different UI placements for a subset of users, you can see exactly which version leads to faster adoption.
Duration is your ultimate proxy for long-term product-market fit. It analyzes how long users continue to find value in the feature over months. If usage spikes at launch but vanishes after thirty days, you've built a novelty, not a core tool. Duration proves that the feature solved a recurring pain point. It's the difference between a one-hit wonder and a feature that drives retention. If you aren't tracking duration, you're just measuring the success of your launch marketing, not the success of the product itself.
The Feature Adoption Funnel: A 5-Step Diagnostic Process
A usage chart is a post-mortem. A funnel is a diagnosis. If you want to know how to measure feature adoption effectively, you must stop looking at the end result and start looking at the leakage points. Every feature launch is a journey. Users drop out at specific, predictable stages. Understanding where they quit tells you exactly what to fix. Most teams stop tracking once a user clicks a button. That is a mistake. Real adoption happens through a five-step sequence:
- Step 1: Exposure. Did the user even see the feature exists? If your UI is cluttered, your new code is invisible.
- Step 2: Discovery. Did the user understand what the feature actually does? Awareness is not comprehension.
- Step 3: Activation. Did the user complete the primary action once? This is the first "aha" moment.
- Step 4: Adoption. Has the user integrated the feature into their regular workflow? This is habituation.
- Step 5: Intervention. Triggering a fix for users who dropped off at steps 1 through 3. Measurement without action is just watching your product fail in slow motion.
Identifying Discovery Failures
If your Depth is high but your Breadth is low, you have a hidden gem. A small group of users loves the feature, but nobody else knows it exists. This is a discovery problem. You don't need to rebuild the feature; you need to move it. The Discovery Gap is the distance between code deployment and user awareness. You can bridge this gap by using in-app banners to highlight specific tools to the right user segments. Don't blast everyone. Target the users who actually need the solution.
Spotting Friction in the Activation Phase
Analyze the drop-off between Discovery and Activation. If users understand what the feature does but never actually use it, you have a friction problem. Complicated setup flows are the primary killer of new features. If a user has to read a manual to start, they will quit. You need to guide them through the first mile. Using Product Tour Software for Onboarding: The 2026 Buyer’s Guide can help you build lightweight, interactive paths that drive users to that first successful action. Stop letting your features die on the vine because of a clunky interface. Simplify the path to value.
Closing the Loop: From Measurement to Intervention
Measurement without action is a wasted investment. Most product teams treat data like a post-mortem report. They find a problem, discuss it in a weekly meeting, and schedule a fix for the next sprint. By then, the user has already churned. To master how to measure feature adoption, you must move beyond passive observation. You need to close the loop between identifying a friction point and deploying a solution. This requires a unified system where your analytics, session replays, and engagement tools share a single identity.
Intervention is the final stage of the funnel we discussed in the previous section. It is the moment you turn a "drop-off" into a "success story." You can achieve this by using integrated feature flags to A/B test different UI variants in real-time. If version A has higher activation than version B, you flip the switch for the rest of your user base. You can also trigger qualitative in-app surveys to ask users exactly why they stopped. This direct feedback, combined with behavioral data, creates a complete picture of the user experience.
Using Session Replay for Qualitative Context
Analytics tell you that a user dropped off. Session replay tells you why. When you see a spike in "rage clicks" or "confusion loops" in your adoption funnel, you don't have to guess the cause. You can watch the exact moment the user got stuck. Most teams waste hours debating whether a button is confusing. You don't need a debate; you need to see the struggle.
Filter your replays for users who started a feature setup but didn't finish. Look for the hesitation. Are they hovering over an icon they don't understand? Are they filling out a form and then deleting the input? This context is the difference between a blind guess and a data-backed fix. For a deeper dive into using these tools effectively, see our Session Replay Software: The No-Fluff Guide.
Deploying Real-Time In-App Interventions
The "Aha moment" is time-sensitive. If a user stalls during activation, you have a narrow window to help them. A unified platform allows you to trigger an in-app messenger or a product tour the moment a user displays "stalling" behavior. You don't need to wait for a data export or a developer to build a custom trigger.
Target users who have reached the discovery phase but haven't activated the feature. Offer a contextual nudge. A simple in-app banner can provide the one piece of information they were missing. Because your messaging tool and analytics share the same data, these triggers are instantaneous and accurate. You aren't guessing who needs help; you are responding to their live behavior. Stop letting users drift away and start closing the adoption loop with Kilden's unified platform.
Scaling Your Adoption Strategy with Kilden
Data silos are a choice. Most companies choose them by default. They buy one tool for analytics, another for session replays, and a third for messaging. Then they pay a "data tax" in the form of engineering hours just to keep these systems synced. Kilden rejects this fragmented reality. We built a unified identity system where every user action, every replay, and every message lives in one place. This is not just about efficiency. It is about truth. When your data is whole, your decisions are accurate.
Scaling a product requires more than just code. It requires a culture that values immediate intervention over monthly reporting. You need to know how to measure feature adoption across every department, not just within the product team. If your data is locked behind a paywall or a complex query language, your adoption strategy will fail. Kilden democratizes this insight, moving your team from passive observation to decisive action.
Eliminating the Per-Seat Barrier
Traditional analytics platforms treat data like a luxury. They charge per-seat licensing fees that force you to choose who gets to see the truth. This is a mistake. Customer Success needs to see when a high-value account stalls. Marketing needs to see which banners actually drive activation. Product needs to see the friction. When you limit access, you create blind spots.
Kilden removes this financial friction. Our no-per-seat model ensures that every stakeholder has a direct line to user behavior. This transparency kills the "guessing games" that plague most product meetings. Everyone looks at the same dashboard. Everyone sees the same funnel. You can explore this shift further in our guide to The Modern Product Analytics Platform: Unifying Insight and Action in 2026. Stop paying for seats and start paying for results.
The Power of a Unified Product Growth Suite
Measurement is only half the battle. The real work begins when you close the loop between insight and engagement. Because Kilden integrates feature flags and engagement tools into a single platform, you can respond to user behavior in real-time. You see a drop-off in your adoption funnel. You watch the session replay to find the "why." You launch a no-code in-app campaign to fix it.
This workflow doesn't require a developer ticket or a month-long sprint. PMs can move from identifying a problem to launching a solution in under 10 minutes. This is how you master how to measure feature adoption at scale. You build a system where the data is accessible, the context is clear, and the action is instantaneous. Stop managing fragmented stacks and start growing your product. Build your culture of truth and action today.
Turn Your Adoption Data Into Action
Stop watching your features die on the vine. You now have the framework to move from passive reporting to active growth. Understanding how to measure feature adoption is only the first step. The second is acting on that data before your users churn. You've learned to look beyond total usage and focus on the diagnostic funnel. You've seen why unified data is the only way to bridge the gap between measurement and intervention.
Fragmentation is a choice you no longer have to make. You don't need a dozen disconnected tools to understand your users. You need a single source of truth. Kilden provides this by unifying product analytics, session replay, and engagement tools into one platform. With no per-seat licensing, your entire team can access the insights they need to build a better product. No more data silos. No more guessing. It is time to treat your users like humans and your data like a roadmap.
Start Measuring and Fixing Adoption with Kilden. You have the diagnostic tools. Now, go build something that sticks.
Frequently Asked Questions
What is the difference between product adoption and feature adoption?
Product adoption is the macro metric of a user committing to your entire platform. Feature adoption is the micro metric of a user finding value in a specific tool within that platform. A user can adopt your product but ignore 80% of its features. You must track both to ensure long-term retention and avoid becoming a one-trick software. High product adoption with low feature adoption is a churn risk.
How do you calculate a feature adoption rate?
Divide the number of unique users who performed a key action within a feature by the total number of target users for that feature. Multiply by 100 to get the percentage. This is the standard for how to measure feature adoption accurately. Always define your key action carefully. A click isn't adoption. Completing a specific, value-driven task is the only metric that matters for your roadmap.
What is a good feature adoption rate for a SaaS product?
Benchmarks vary by industry, but a healthy rate typically falls between 20% and 40% for core features. Secondary features often see much lower rates. Don't chase a 100% adoption rate. It is impossible and unnecessary. Instead, focus on the user segments that actually need the feature. Aim for high depth within those specific groups rather than shallow usage across your entire base.
How can I measure feature adoption without a dedicated dev team?
Yes. Modern all-in-one platforms allow product managers to track events and launch engagement campaigns without writing code. You can use visual taggers to identify buttons and menus. This eliminates the engineering bottleneck. You can deploy product tours, banners, and surveys directly from your dashboard. It empowers you to move fast and test adoption hypotheses in real-time without waiting for a developer ticket.
Can session replay help improve my feature adoption metrics?
Session replay provides the qualitative why that standard charts miss. It reveals the exact moment a user gets confused or frustrated. You might see a user hover over a button but never click. This indicates a discovery or clarity issue. Fixing these friction points based on visual evidence directly improves your how to measure feature adoption outcomes. It turns abstract data points into actionable human behaviors.
How often should I report on feature adoption to my stakeholders?
Report high-level trends to leadership monthly, but monitor your diagnostic funnel weekly. New feature launches require daily check-ins during the first two weeks of code deployment. Stakeholders need to see the impact of R&D spend. Provide them with data that shows not just usage, but the correlation between feature adoption and long-term user retention. Clear reporting justifies your future product roadmap decisions.
What are the most common reasons for low feature adoption?
The three biggest killers are poor visibility, high friction, and lack of perceived value. If users can't find it, they won't use it. If it's too hard to set up, they'll quit. If they don't see how it solves their specific pain, they won't care. Always audit these three pillars before you consider rebuilding a feature. Most failures are just onboarding problems that need immediate intervention.
Is it possible to track feature adoption for mobile and web simultaneously?
Absolutely. A unified identity system allows you to track a single user across multiple platforms. This is essential for modern cross-platform products. You need to know if a user starts a task on their phone and finishes it on their laptop. Fragmented tracking leads to double counting and inaccurate data. Use a platform that supports unified user IDs to see the whole truth of your user journey.